At the first access to the platform, all the features of the platform are immediately available thanks to the practical menu and all the data thanks to the customizable Dashboard.
On the left side you can see the menu that facilitates navigation within the platform:
- Analytics
- Journey
- Target
- Direct Marketing
- Website
- Users
- Media Gallery
- App Center
- Advertising
- Settings
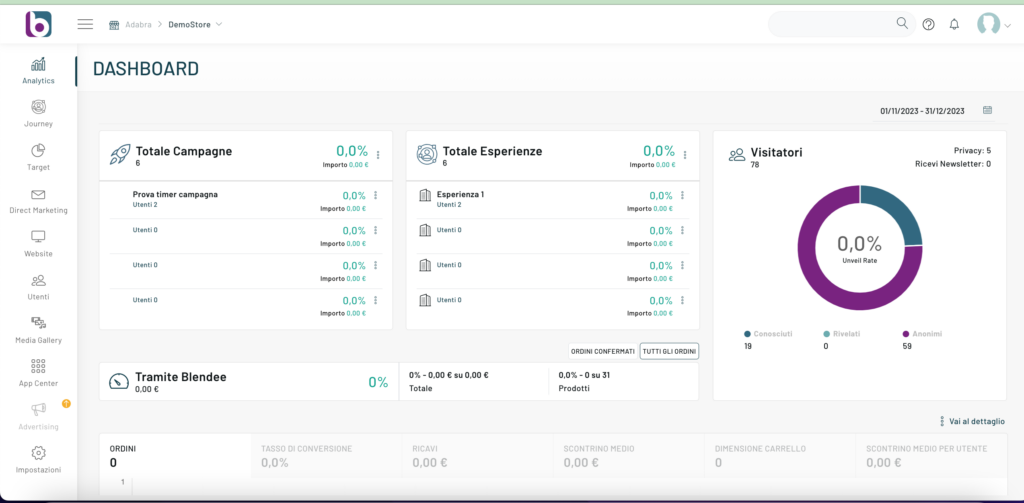
In the central part, when you first log in, you will see the Dashboard with all the information you need to define accurate strategies and evaluate their effectiveness.
The Dashboard allows you to select an analysis period via the period selection menu located at the top of the data.

It is also possible to customize the Dashboard by moving and sorting the information blocks according to your needs simply with drag and drop.
The information shown differs depending on the type of portal purchased. There are also some common elements:
Total Campaigns

Shows the results and performance of your campaigns over the selected time period.
Total Experiences

Shows the results and performance of experiences over the selected time period.
Visitors

It allows you to see the status of your customers at a glance, including anonymous ones
Instructions

Turnover related to orders, with total acquired through the use of Blendee customizations, with the possibility to select only confirmed orders.
Order Chart

Temporal graph with the distribution of orders, with tabs related to conversion rate, revenues, average receipt, cart size and average receipt per user.
Thanks for contributing!