In this article, we dive deeper into the details of Form charts on the Dashboard.
Each graph in the Dashboard allows you to access a part that drills down into each piece of data in detail.
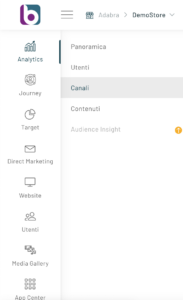
The screen opens by dragging the mouse over the Analytics item in the left sidebar, and clicking Channels.
A page with 3 tabs will open, clicking on the three dots of the Form tab will open a new page with all the details.

The page is divided into two sections, the first with the graph of the trend of the forms in the selected period while in the second you will find a list of the forms with the related data including, Id, Name, Unique Leads, Unique Views and Clicks and actions (statistics for each Form)

Was this content useful?
Thanks for contributing!