The third section of the Dashboard is the one dedicated to communication channels, let’s take a closer look at it…
Inside we find four blocks:
Form Block
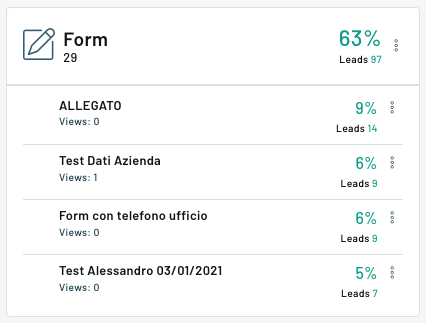
In the form block we can check the leads that are generated by each individual form and its percentage.
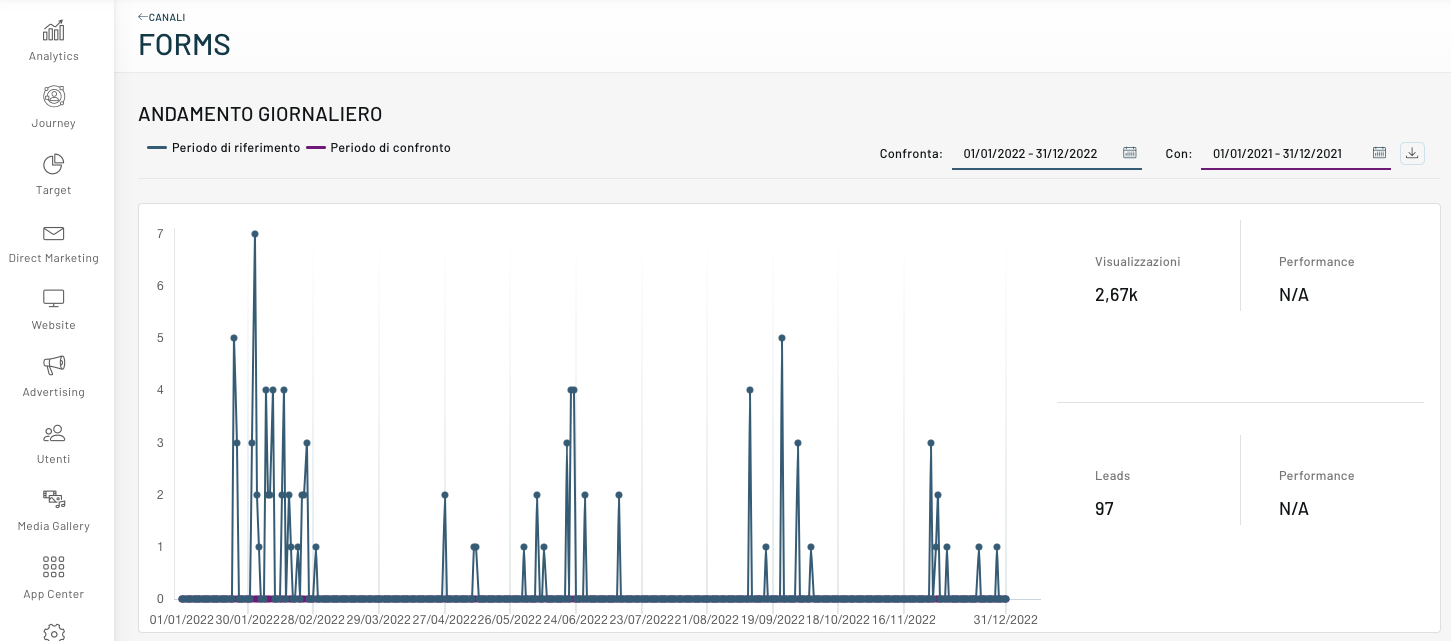
In addition, by clicking on the 3 dots on the right, we access a detailed panel with all the data of the forms, as shown in the figure, very useful for keeping the progress of the forms under control.
Newsletter Block
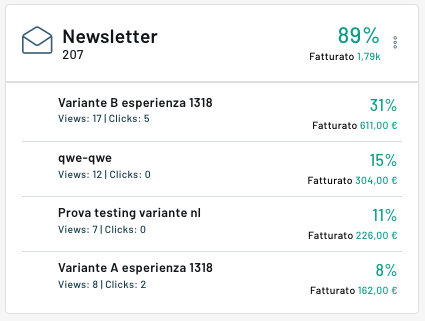
In the newsletter block we can check the turnover that is generated for each newsletter.
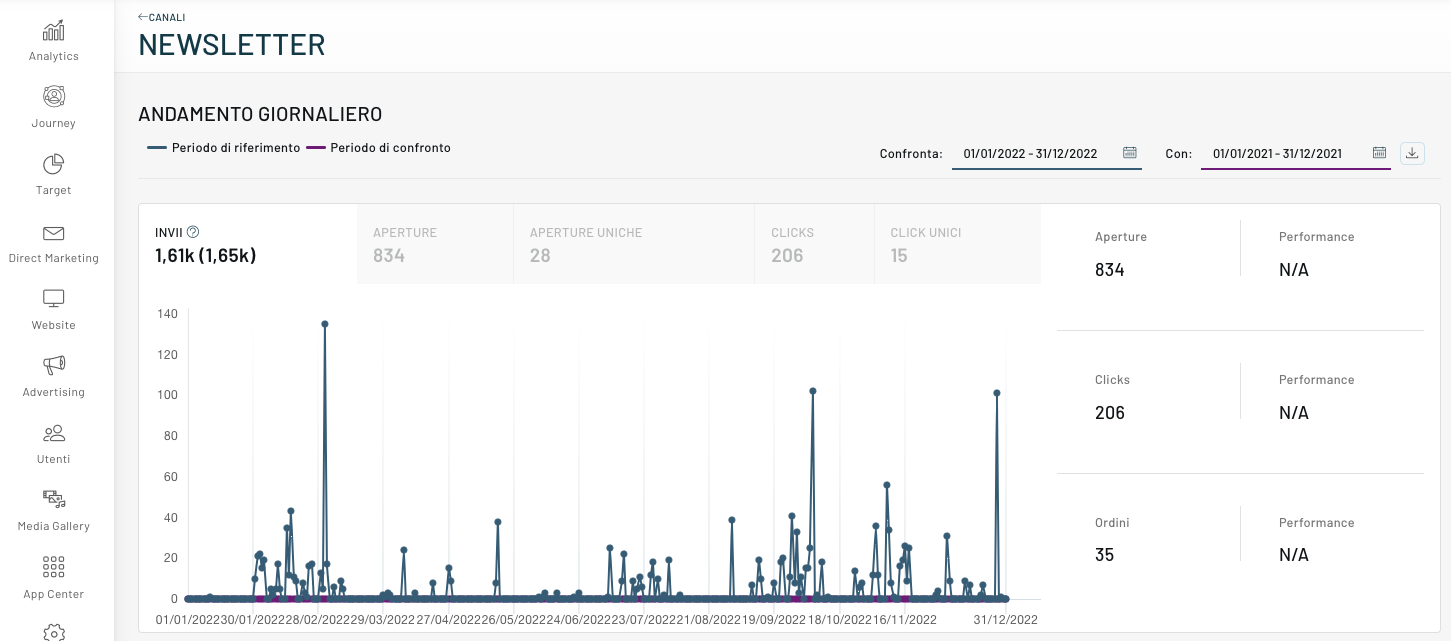
By clicking on the 3 dots on the right, where it will show in detail all the data and statistics of the newsletters sent according to the chosen period.
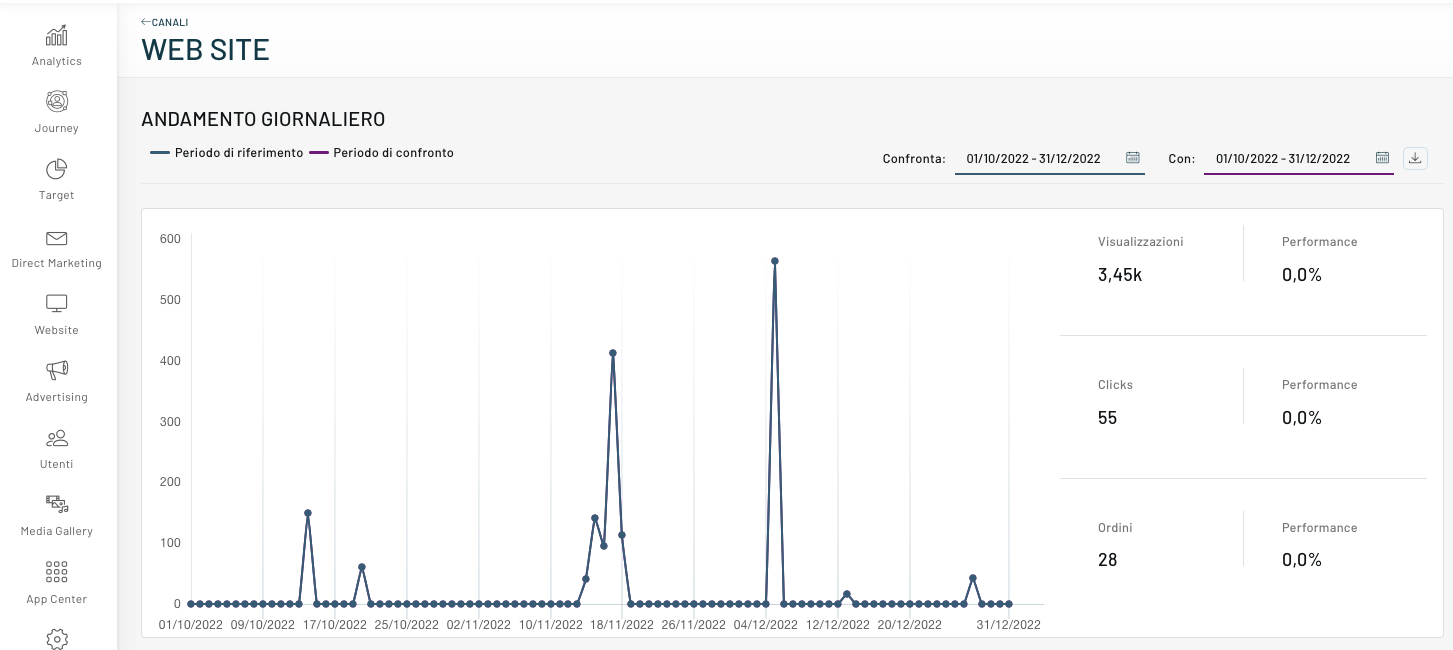
Web Site Block
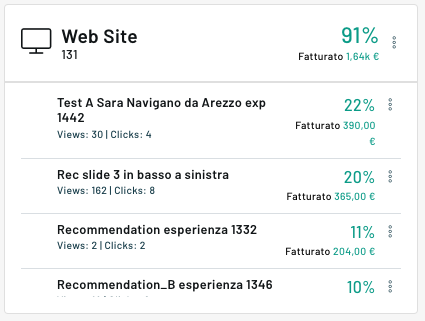
In the website block, we can check the turnover of each active website activity in the portal.
By clicking on the 3 dots on the right, where it will show in detail all the data related to website activities, i.e. recommendations and behavioral messages.
Thanks for contributing!