Among the various features offered by Blendee within the “Email Marketing” module, in the “Campaign Management” section, statistics undoubtedly play a primary role.
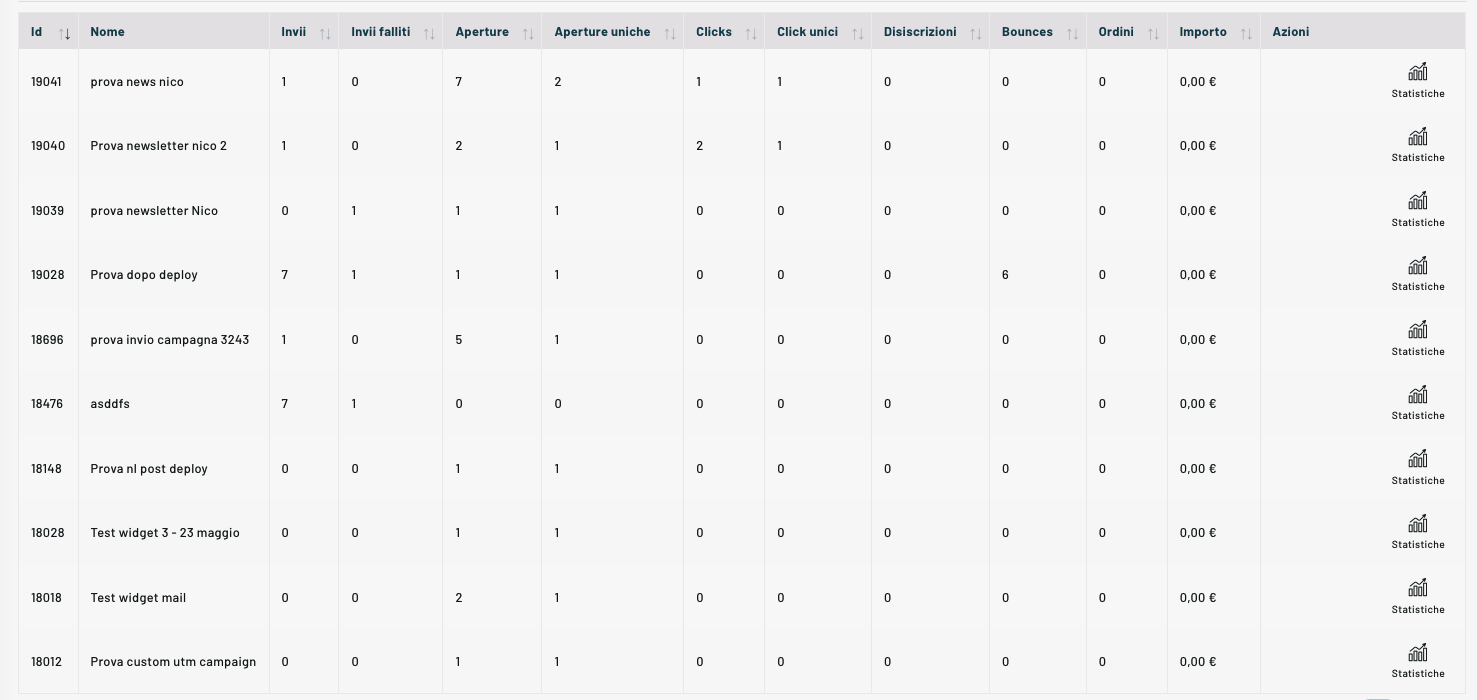
It is possible to view the statistics of each email sending by selecting the specific item within the table containing the summary of the newsletters sent and created.
You can also see the general statistics for newsletters from the Analytics -> Channels menu by selecting the symbol next to “newsletter”

Once you click on the relevant icon, you will access the summary page where you can monitor numerous KPIs related to our email sending, such as:
- Total Submissions
- Total openings
- Unique openings
- Total clicks
- Unique Clicks

By selecting the different tabs in the graph, it is possible to view the graph relating to sends, openings and clicks, but not only: among the KPIs reported on the statistics summary page we also find, under the graph:
- open rate
- click to rate
- Conversion Rate
To find out more information about those who have opened, viewed or clicked on the newsletter, go to the table below and click on the Actions column on the Statistics icon.
Sends & Bounces
Among the data provided in the detailed statistics we also find a summary of sending, openings and clicks grouped by domain.

In addition to data and information relating to openings and sends, among the data provided on the panel we also find those relating to bounces and unsubscribed users.
In addition to the summary data, you can view the details of individual bounce and unsubscribe contacts by clicking on the three dots corresponding to the two items.
Detailed statistics by email
Once the email detail is opened, by selecting a particular tab, you can view which email addresses the email was sent to and when.
Send
As far as the submissions tab is concerned, we find in detail in the table:
- Email Address
- domain
- date
- state
- Error message
- User Detail

Unique Openings / Openings
On the other hand, as far as the tab is concerned, unique openings and openings in detail we find for each individual user:
- city
- Mobile view (whether it was made or not)
- date
- User Detail

Unique Clicks / Clicks
On the other hand, with regard to clicks, the information provided concerns:
- city
- Mobile view (whether it was made or not)
- Referrer
- date
- User Detail

Total Amount and Number of Orders
In this tab you can see the turnover brought by an email and various information on:
- Amount
- Number of products
- Date
- City
- On mobile
- Referrer
- User Detail
By clicking on the “User Details” icon there is the possibility to directly access the user data where it is possible to find the user activity as illustrated in this article.
Thanks for contributing!